i got really distracted working on something else and ended up making an animation of every NWS alert this year w/ data from @akrherz / iowa enivornmental mesonet: https://t.co/FOp4t4Bay4pic.twitter.com/dKRYlzwH1V
— jim hollenbach (@jdhollen) May 31, 2018
This extreme weather map is terrifying and hypnotic
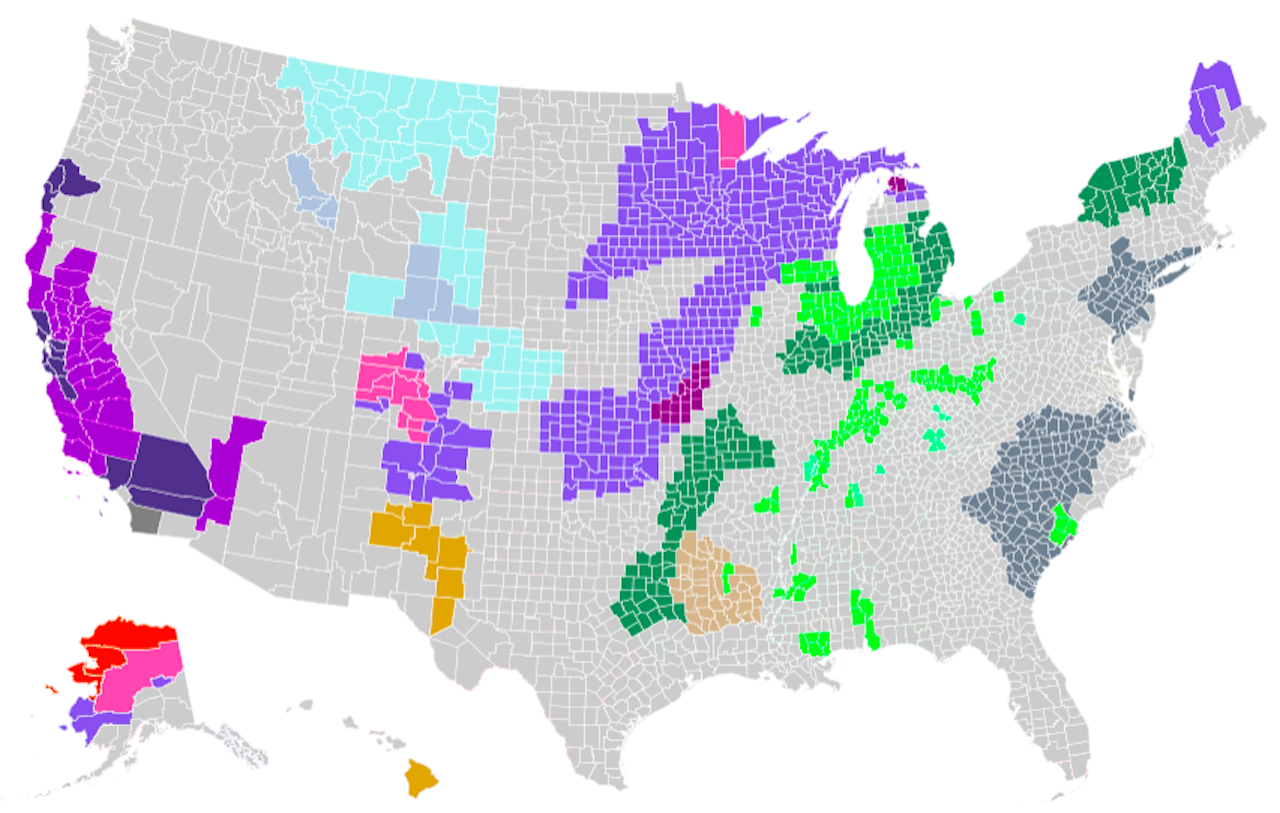
TGIF! While you’re sitting at your desk, walking to work, or doing whatever you happen to be doing on this lovely Friday morning, here is a hypnotizing video showing every terrifying weather event in the continental U.S. and Hawaii from 2018 (so far). The map was created by software engineer Jim Hollenbach, using data provided by Iowa State University agronomist Daryl Herzmann. (Also, a slower version of the video can be found on Hollenbach’s website. Just adjust the speed using the speedometer in the bottom-left corner).
Each county forms a mini-tile on the map, with the severe weather advisories—which range from wind chill advisories to blizzard watches and fire warnings—appearing in different colors depending on the type of weather event. The wave-like effect of the weather flare-ups may be relaxing to watch, but it’s hard to forget climate change is what makes many of these extreme events more likely, including heat waves, hurricanes, heavy rain events, floods, droughts, wildfires, and blizzards, which have human consequences like food insecurity, water insecurity, and trillions of dollars in financial losses.
On his website, Hollenbach addresses one pressing question: “Why are the colors so ugly?” He explains that he didn’t choose the colors on the map; the NWS assigns them based on the type of weather emergency at hand. For instance, the NWS issues coastal and lakeshore flood statements in “Olivedrab” (#6B8E23) and blowing dust advisories are issued in “Darkkhaki” (#BDB76B). So don’t blame Hollenbach for any expired-hummus-colored counties.
Why spend (presumably) hours sorting through weather data and writing code so that we can see crazy weather pop up and disappear on a map? According to his tweet, Hollenbach was just bored at work.